Now that you’ve mastered the basics of graphing rational functions, let’s get into some of the complicated details. Today we’ll discuss slant asymptotes and holes in the graph.
There’s a Hole in the Graph!
The function we played with for the first two posts about rational functions,  , is a particularly friendly rational function. The x’s that make the numerator equal zero are different from the x’s that make the denominator equal zero. It’s also friendly because the numerator and denominator have the same degree, so you get a nice horizontal asymptote. In order to make things a bit more interesting today, let’s play with this function:
![\[R(x) = \dfrac{(x+4)(x+1)(x-1)}{(x+1)(x-3)}\]](http://rowsontutoring.com/wp-content/ql-cache/quicklatex.com-4b3fbcdb3d275844409a0238777f7b8e_l3.png "Rendered by QuickLaTeX.com")
You may have noticed that both the numerator and denominator have a common factor,  . This means that if we plug in
  , both parts of the fraction will equal zero – something even more bizarre than simply dividing by 0. When you have a common factor in numerator and denominator, cancel them out, but make note of what the x-value is – this is where a hole will be. Our modified function:
 , with a hole at
To find the coordinates of the hole, you plug the hole’s x-value into the simplified function:  . This means that the graph’s hole will be at
  .
.
Combining that with techniques we’ve already covered, we know:
x-intercepts at: -4, 1
y-intercept at: 
Vertical Asymptotes at: 3
Hole at
Sign Pattern: ![]()
Our next step is to determine the function’s end behavior, which in this case will involve a slant asymptote because the numerator has higher degree than the denominator.
Finding a Slant Asymptote
To find a slant asymptote, we’ll need to use either polynomial long division or synthetic division.
First, you need to multiply out your numerator (and, if applicable, your denominator).

Now, divide the polynomials, using whichever method you prefer. In the end, you should arrive at  with a remainder of 14. For slant asymptotes the remainder isn’t important, so you can ignore it. Our function’s slant asymptote is
  .
.
Slant asymptotes, like horizontal asymptotes, only tell us about the end behavior of a graph (what happens when x-values are far from x=0). This means that the far left and right sides of your graph should aim along the asymptote, but that it’s OK to cross the asymptote in the middle of the graph.
Preparing the Graph
Prepare to graph your rational function by sketching in everything you know so far: x-intercepts, y-intercept, vertical asymptotes, holes, and slant asymptotes. I always like to sketch asymptotes with a dashed line. Here’s what my prepared graph looks like (I graphed the hole in blue so that it would stand out):
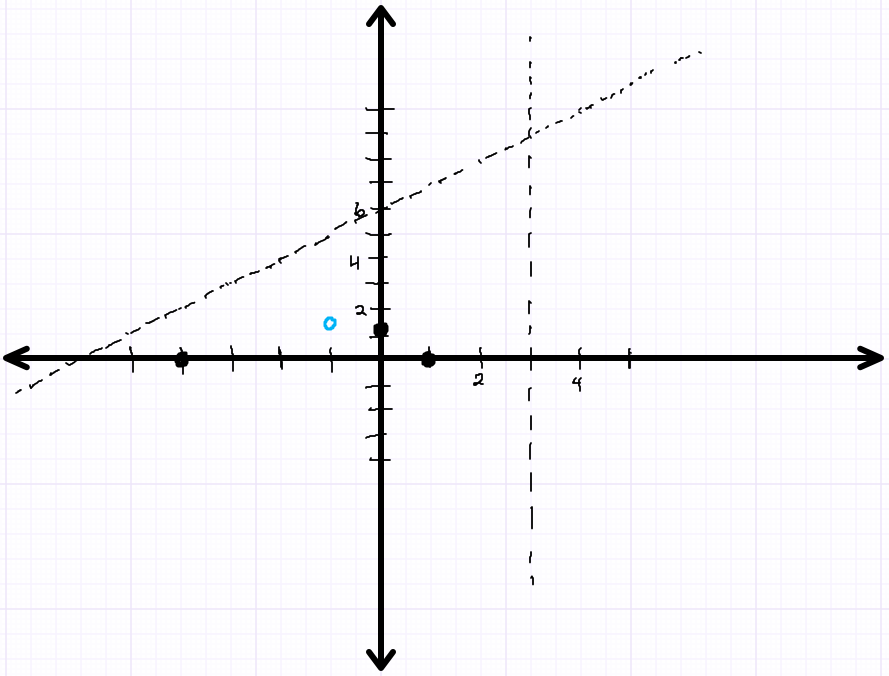
Now you can combine your graph preparations with what you know from the sign pattern to complete the graph. As before, we’ll work from left to right.
![]()
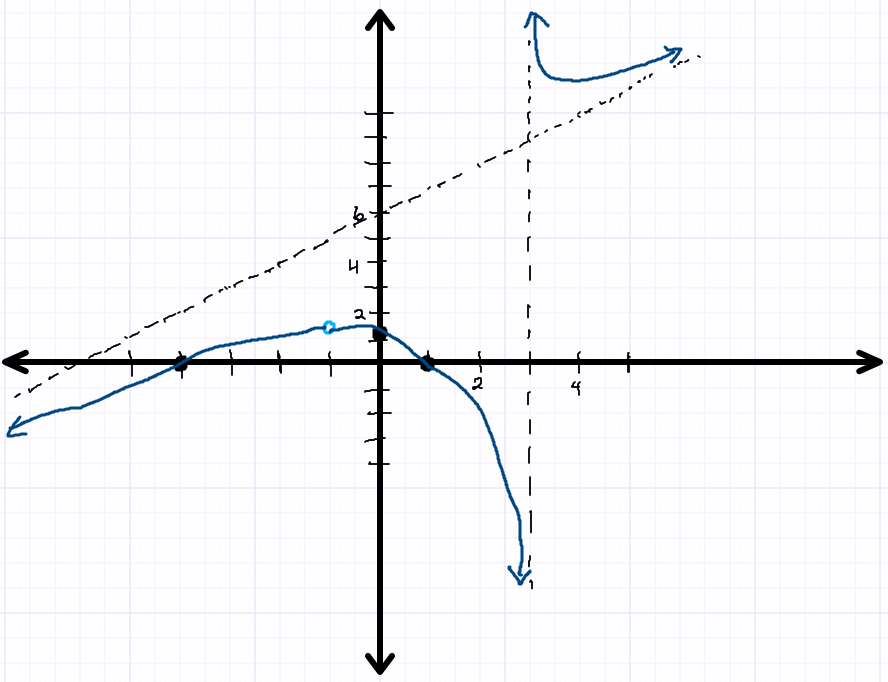
- For x-values less than -4, the graph is always negative. Since this is our leftmost part of the graph, it will follow the slant asymptote to the far left, and then head towards the x-intercept at -4.
- For x-values between -4 and 1, we know that the graph is always positive. We also know that there is a hole at , and a y-intercept at
 . Plot a line above the x-axis that connects the x-intercepts and passes through the hole and y-intercept. Make sure to show the hole as an empty circle, not a filled in dot.
 - Between x-values of 1 and 3, the graph is always negative. Start at the x-intercept at x=1 and then head to the right and downwards to approach the vertical asymptote at x=3.
- Finally, for the x-values greater than 3, we know that the graph is always positive. There are also two asymptotes in this section, the vertical asymptote at x=3 and the slant asymptote. You want to start way up on the vertical asymptote, head down towards the slant asymptote and then turn to follow the slant asymptote off to the upper right.
- Graph complete!
Conclusion
Finding holes in graphs isn’t too hard once you know how to do it: If a factor appears in both the numerator and denominator you can cancel it out. Take note of what x-value would make your canceled factor equal zero, and then plug that x-value into the simpler rational function to find the y-coordinate of the hole.
The big secret to finding slant asymptotes is just to remember how to divide polynomials. Once you’ve got polynomial division figured out, slant asymptotes are easy!
Do you have any questions about graphing rational functions, holes, or slant asymptotes? Would you like me to provide practice problems? Let me know in the comments below!