Now that we’ve covered some of the basics of rational functions, let’s dive into graphing them. In this post I’ll talk about how to graph basic rational functions, and in the next post I’ll explain how to deal with more complicated rational functions.
Information You’ll Need
First, determine the roots, the y-intercept, any domain restrictions, and create the sign pattern. If you’re unsure about how to do any of that, refer to this post. For graphing purposes, we’ll use slightly different terminology. Instead of calling x-values that make the numerator equal zero the roots, we’ll call them the x-intercepts. Domain restrictions are called vertical asymptotes.
For now, let’s play with the same function as before: 
x-intercepts: -3, 2
y-intercept: 
vertical asymptotes: -1, 4
Sign pattern: 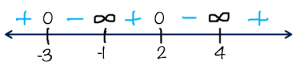
Horizontal Asymptotes
Next you’ll want to determine your function’s horizontal asymptote. Start by determining the degree of the polynomial in the numerator (“deg(N)”) and the degree of the polynomial in the denominator (“deg(D)”).
- If deg(D) > deg(N), then the horizontal asymptote is y=0, the x-axis.
- If deg(D) = deg(N), then the horizontal asymptote is a fraction where the numerator is the leading coefficient of the numerator polynomial, and the denominator is the leading coefficient of the denominator polynomial.
- If deg(D) < deg(N), then you don’t have a horizontal asymptote… we’ll talk about this in the next post.
In our example, , the degree of the numerator and denominator are the same (both are 2), so we need to look at the leading coefficients. The leading coefficient of the numerator is 1, as is the leading coefficient of the denominator. This means that the horizontal asymptote for our rational function is  .
.
A Note on Asymptotes
Vertical asymptotes turn up when you are at an x-value that causes the function to be divided by 0. Because you literally can’t use that x-value in the function, your function will never cross a vertical asymptote.
Horizontal asymptotes are there to show you a graph’s end behavior, where the graph hangs out as x gets very big (far to the right) or very small (far to the left). They only tell you about what’s going on when you have x-values that are far from 0. This means that in the part of the graph where a lot is going on, it’s totally fine to cross a horizontal asymptote. The same is true for slant asymptotes.
Making a Graph
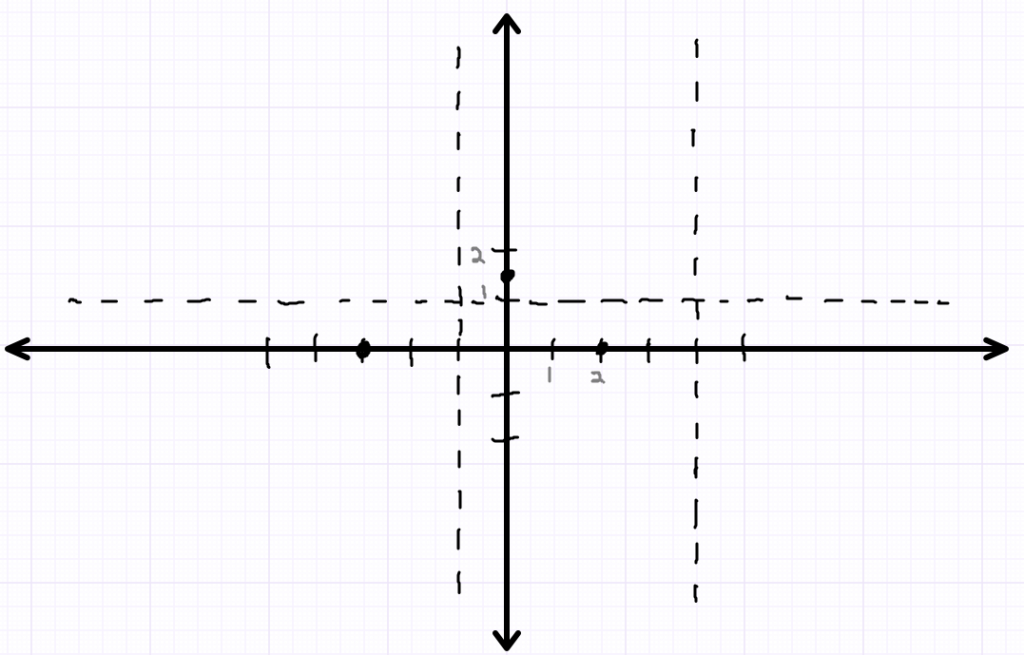
Now that you’ve got a sign pattern and know the horizontal asymptote, you can start preparing your graph. Put x- and y-intercepts into place, and add in dashed lines for vertical and horizontal asymptotes.
Let’s work from left to right with the sign pattern.
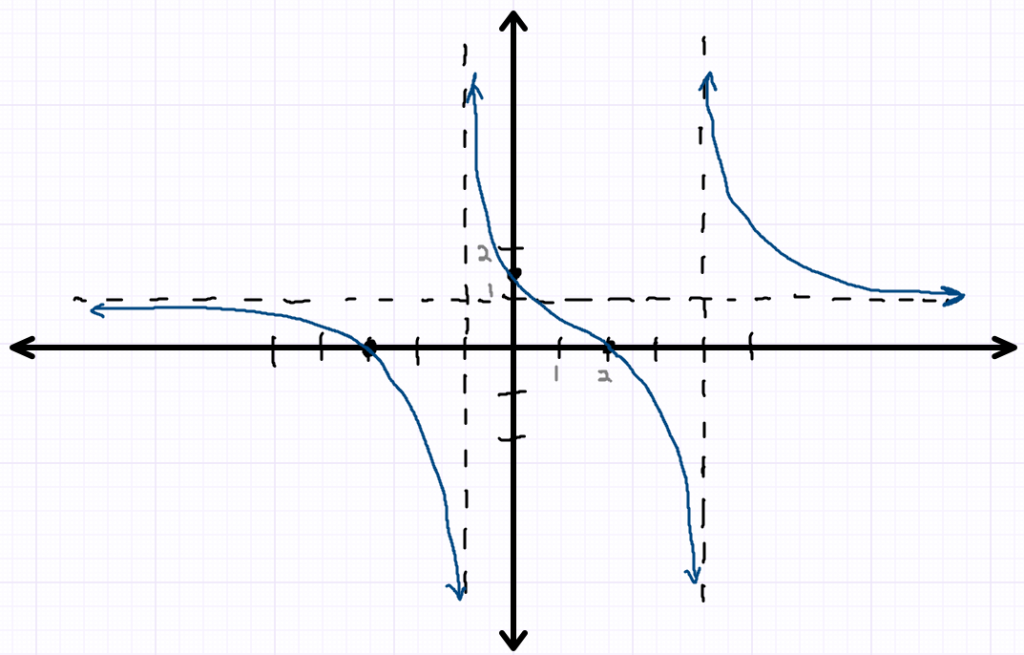
- We know that the portion of the graph to the left of -3 is always positive, and that it must hit the x-axis at -3. Since there’s a horizontal asymptote, I’ll come in from the left near the asymptote, and then swoop down towards (-3, 0).
- Since the graph changes signs as we pass through -3, and then remains negative until the asymptote at -1, I’ll continue swooping down through (-3, 0), and then approach (but not cross!) the vertical asymptote.
- Between -1 and 2 the graph is always positive. I’ll start way up on the asymptote at -1, and then swing down through the y-intercept of
 on my way to x=2, the next x-intercept.
 - The graph changes from positive to negative at x=2, so I’ll keep aiming down through the point (2, 0), and then plunge downward as I approach the vertical asymptote at x=4.
- Finally, to the right of the asymptote at x=4, the graph is always positive. I’ll start way up the asymptote near x=4, then swing downwards and to the right, approaching the horizontal asymptote.
- And you’ve got a graph!
Conclusions
As you can see, having an accurate sign pattern makes it much easier to graph rational functions. You want to double check that you have your x-intercepts and vertical asymptotes correct, and that you accurately determined the sign of the function in each interval created by those interesting x-values.
In the next post we’ll talk about rational functions where there is a slant asymptote instead of a horizontal asymptote, and we’ll address how to deal with holes in the graph.
Do you have any questions about the graphing process above? Would you like me to provide practice problems? Let me know in the comments below!