Today let’s work on graphing quadratic functions. A quadratic function is a quadratic equation where instead of 0 on one side of the equals sign, you have ![]() or
or ![]() . Remember: every point on a graph is an x, y pair that makes the function equation true. For purposes of demonstration, let’s use this function:
. Remember: every point on a graph is an x, y pair that makes the function equation true. For purposes of demonstration, let’s use this function: ![]()
First things first…
What do quadratic functions look like?
Parabolas! And if the word parabola doesn’t mean anything to you, then they look somewhat like the St. Louis Arch. Here are three quadratic functions: 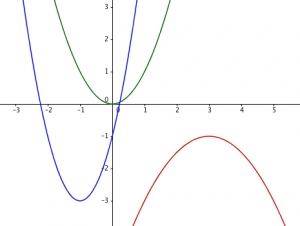
The most basic quadratic function is ![]() , which is shown on the graph in green (passing through the origin). You can see that the other two graphs are distorted versions of that basic graph, stretched, shifted, and, for the red graph, flipped upside down.
, which is shown on the graph in green (passing through the origin). You can see that the other two graphs are distorted versions of that basic graph, stretched, shifted, and, for the red graph, flipped upside down.
In order to graph quadratic functions, we will concentrate on these attributes: y-intercept, x-intercept(s), axis of symmetry, partner points, and vertex.
Finding the y-intercept
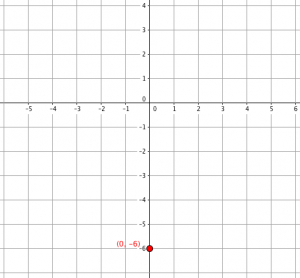 The y-intercept of a function is the place where the graph crosses the y-axis (the vertical axis). No matter where you are on the y-axis, the x-coordinate is zero. To find the y-intercept, plug zero into the equation as the x-value.
For our example, ![]() ,
, ![]() , so
, so ![]() is the y-intercept. You can plot the point
is the y-intercept. You can plot the point ![]() on your graph.
on your graph.
Finding the x-intercept(s)
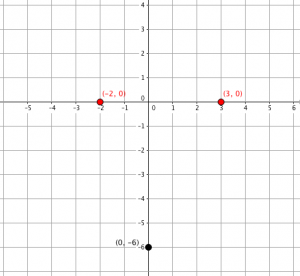 You already know how to do this! Instead of y or f(x), set your equation equal to 0 and solve the quadratic equation for x. These values, if there are any, are the x-intercepts, also known as the roots or the zeros of the function.
For our example, ![]() , I’ll solve by factoring:
, I’ll solve by factoring: ![]() , becomes
, becomes ![]() , so
, so ![]() or
or ![]() . These are your x-intercepts, where y is zero. You can plot
. These are your x-intercepts, where y is zero. You can plot ![]() and
and ![]() .
.
You can use the power of the quadratic formula to predict if a quadratic function will have roots and if it will be factorable. You use the discriminant, ![]() , which is the part of the quadratic formula that lives under the square root symbol:
, which is the part of the quadratic formula that lives under the square root symbol: ![]() . If
. If ![]() is negative, you can’t take the square root, so the parabola won’t intersect the x-axis. If
is negative, you can’t take the square root, so the parabola won’t intersect the x-axis. If ![]() , then it will only intersect the x-axis once – the vertex will be on the x-axis. If
, then it will only intersect the x-axis once – the vertex will be on the x-axis. If ![]() is positive, you will definitely have two x-intercepts, and if
is positive, you will definitely have two x-intercepts, and if ![]() is a perfect square, then the equation is factorable.
is a perfect square, then the equation is factorable.
Axis of Symmetry
You may have noticed when you were looking at the first picture of parabolas above: parabolas are symmetrical. They have a lowest or highest point (called the vertex), and a vertical line through that point is called the axis of symmetry. If you had a parabola on a piece of paper and folded the paper along the axis of symmetry, the left and right sides of the parabola would line up with each other. This means that any pair of points with the same y-coordinate (which I call partner points) will be equally far from the axis of symmetry.
Since the x-intercepts both have a y-value of 0, we can average them to find the axis of symmetry.
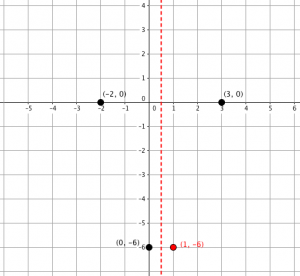 In our example,
 ![]() .
. ![]() is the axis of symmetry. You can add that into your graph with a dashed line.
is the axis of symmetry. You can add that into your graph with a dashed line.
Note: If your function does not have any x-intercepts, you can find the axis of symmetry with the equation ![]() , which is part of the quadratic formula. For this example:
, which is part of the quadratic formula. For this example: ![]() , so
, so ![]()
![]() .
.
You can see that the y-intercept is 0.5 units away from the axis of symmetry, so its partner point must be 0.5 units away in the other direction, at ![]() .
.
Finding the Vertex
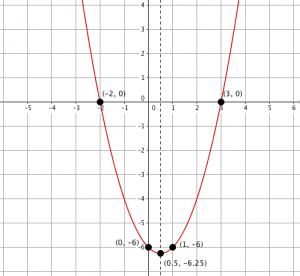 We already know that the vertex, the turning point, lies on the axis of symmetry. This means that we already know the x-coordinate of the vertex! You can plug that value in for x in the original function equation.
For our example: plug ![]() into
into ![]() :
: ![]()
![]() . You can plot the vertex now at
. You can plot the vertex now at ![]() , and then connect your plotted points for a sketch of the quadratic function!
, and then connect your plotted points for a sketch of the quadratic function!
Smiley vs Frowny
You can predict what direction the parabola will face using the leading coefficient (a in the quadratic formula). If the leading coefficient is positive, the parabola will face upwards, or be a “smiley” parabola. If it is negative, the parabola will face downwards, a “frowny” parabola.
Putting it Together
Depending on how accurate your graph needs to be, sometimes finding the vertex and knowing which way the parabola faces is enough. Sometimes you only really care about the x-intercepts and smiley/frowny. Sometimes you want as much detail as you can get – you can get even more points to plot if you pick an x-value, plug it into the equation to get the y-value that goes with it, and then plot it along with its partner point. In another post we’ll talk about transformations of toolkit functions, another way to graph quadratic functions that for some people feels less fiddly and more intuitive than this method.
Did you learn anything new from this post? Do you have a different method of graphing quadratic functions that you’d like to share? I would love to know what you thing – please comment below!
Hadn’t heard the expression ‘toolkit’ function before, guessing that would be the squared, cubic, reciprocal, square root function? Any others?
It varies by teacher and curriculum, but generally constant, linear, quadratic, cubic, square root, cube root, absolute value, and reciprocal, if I’m remembering everything correctly.