When I learned how to graph polynomials I felt like I had gained a superpower. For some reason it always struck me as such a neat thing to be able to do. As they say, with great power comes great responsibility, so I am responsibly sharing my superpower of graphing polynomials with you! You might want to brush up on polynomial vocabulary before diving in.
End Behavior
When you’re talking about the end behavior of a graph, you’re talking about what happens to the far right side (as x gets big) and the far left side (as x gets really negative).
To the right
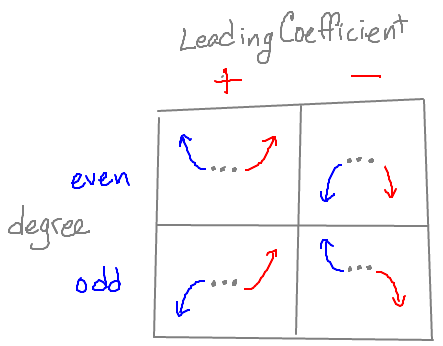
The behavior of the graph on the right hand side is determined by the leading coefficient of the polynomial. If the leading coefficient is positive, the graph will go positive (up) to the right. If the leading coefficient is negative, the graph will go negative (down) to the right. It might help to think about the right side of a parabola (a type of polynomial): the a coefficient determines if it’s smiley or frowny. Same deal here, but we’re only talking about the right side.
To the left
The key to the left side is the degree of the polynomial, combined with knowing what the right side is doing. If the degree is even (like in a quadratic function), the left side of the graph will agree with the right – either both will go up or both will go down. If the degree is odd (like in a cubic function), the sides will disagree – whatever direction (up/down) the right side is headed in, the left will go the other way.

But… the polynomial is factored!
Fear not! You got this.
First, the right side:
Look at each time x shows up. If all of the x‘s have positive coefficients, then the leading coefficient (if you multiplied it all out – which you shouldn’t bother to do) is positive. If there are an even number of negative x coefficients, the leading coefficient is still positive (because every pair of negatives multiplies to a positive). If you have an odd number of negative x coefficients, then the leading coefficient will be negative – the right side is going down.
Next, the left side:
Look at all of the x‘s again. Count them. If you have an ![]() , it counts as two x‘s, an
, it counts as two x‘s, an ![]() counts as 6 x‘s, etc. The number of x‘s you counted in the function is the degree. The same even/odd rules determining left side behavior from above apply.
counts as 6 x‘s, etc. The number of x‘s you counted in the function is the degree. The same even/odd rules determining left side behavior from above apply.
Now that you’ve got an idea of what the “arms” of the polynomial look like, let’s figure out the middle.
The Roots & A Sign Pattern
Here’s where we’re hoping that the polynomial that we’re playing with is in factored form. If not, other methods will be needed that are not included in today’s post (the rational root theorem and synthetic division). Get that polynomial factored and then come back.
Step by step with example polynomial ![]()
- Determine the roots of the polynomial. You’re using ZPP (zero product property) here; basically set each factor equal to 0 and solve for x. If a root shows up more than once, take note! For example, if you’ve got
 as one of your factors, that means that 3 is a root four times over (this is called the multiplicity of the root). The roots for our example polynomial are 1 (twice), -1 (three times), and -3 (once). If you have a factor that you can’t solve, like
  , you can ignore it and not worry about the roots for that one.
 - Begin a Sign Pattern by placing the roots on a number line. Put the root below the line, and a zero above each root to indicate that the y-value at each of those points is 0. Now we’ll focus on the segments of number line created by the roots. The segments from
 to -3, from -3 to -1, from -1 to 1, and from 1 to
  .
.
- Fill in the ends: you know what y will do to the far right and far left of the sign pattern, based on the end behavior you figured out above. If y will be positive, put a plus sign above that section of the number line. If negative, a minus sign. For our example, the leading coefficient is positive, so the right will have a +, and the degree is even, so the left will also have a +.

- Each time you move from one segment to the one next to it, you cross over a root. Whether the sign will change between segments depends on the multiplicity of the root. If the multiplicity is even, the sign stays the same. If it is odd, the sign changes. In our example, x=1 has even multiplicity, so the sign will be the same on both sides (positive on both sides, since we already decided the end behavior on the right was positive). For x=-1, the multiplicity is odd, so the sign will switch, positive to the right of -1, negative to the left. For x=-3, the multiplicity is odd again, so the signs will switch again, from negative to the right of -3, to positive to the left (which we already knew from the end behavior).

Graphing
Cross, Bounce, Slide

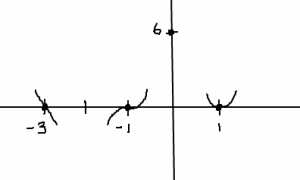
You first want to focus on what happens at each of the roots. You know that there will be an x-intercept at each of them, so you can start by plotting those points. In our example, plot ![]() ,
, ![]() , and
, and ![]() . Then, depending on the multiplicity of each root, you will either cross, bounce, or slide. Multiplicity of one is a cross (think of a line), even multiplicity is a bounce (think of a quadratic), and odd multiplicity greater than 1 is a slide (think of a cubic). Sketch that little bit into the graph, keeping the sign pattern in mind.
. Then, depending on the multiplicity of each root, you will either cross, bounce, or slide. Multiplicity of one is a cross (think of a line), even multiplicity is a bounce (think of a quadratic), and odd multiplicity greater than 1 is a slide (think of a cubic). Sketch that little bit into the graph, keeping the sign pattern in mind. 
Connect the Dots
You might want to figure out (by plugging in ![]() ) and plot the y-intercept at this point. For our example,
) and plot the y-intercept at this point. For our example, ![]() .
.
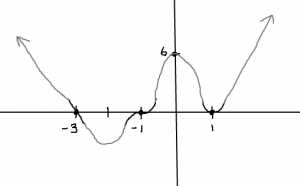
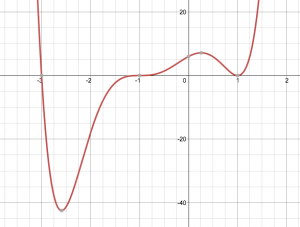
Now, keeping in mind how the graph will act at each x-intercept, the end behavior, and that polynomials are smooth and curvy, sketch the graph in. For now you won’t know where the peaks and valleys are – you need calculus for that – but it’s a pretty decent approximation of what the actual graph looks like. 

Superpower Acquired.
Did you learn something new? Do you have a question for me? Please let me know by commenting below!
Love this post! We don’t cover this in such detail over in the UK(at least I have never seen it) so great to see the detailed analysis of how to plot a polynomial. Students here have access to graphical calculators so can look it all up. Thank you.